How to Analyze your Literacy Intervention Data
Tracking data is only the first step. The real power comes from knowing how to analyze the data and use it to make instructional decisions.
This doesn’t have to be complicated or time-consuming.
But it does require a system that helps you quickly answer:
What is the data really telling me?
Are my students meeting the goals I set for them?
If not, how do I adjust instruction?
Common Pitfalls in Data Analysis
We see well-meaning educators make the same mistakes again and again:
Spending too much time. Getting lost in the numbers instead of using them to make decisions.
Making it personal. Viewing the data as a reflection of your teaching instead of a tool for instruction.
Looking backward only. Treating data as a report card rather than a guide for what to do next.
The good news? These pitfalls are avoidable once you have a clear process.
Step 1: Look for Trends, Not One-Offs
Don’t put all the weight on a single session or “testing day.” Students may perform better or worse than usual depending on mood, sleep, or confidence. Instead, look at patterns over time:
Is accuracy improving week to week?
Are errors shifting to more advanced skills (a good sign of growth)?
Is there a plateau that signals the need for a change?
Aim for a consistent benchmark (like 90% accuracy) and look for stability, not perfection on every attempt.
Step 2: Celebrate Growth When Goals Are Met
If a student consistently meets their goal:
Celebrate with the student and family.
Document the skill as mastered.
Move them into the next level of instruction (a new phonics pattern, more complex text, deeper comprehension tasks).
Success in one area opens the door to targeting the next.
Step 3: Make a Plan When Goals Aren’t Met
When students aren’t meeting benchmarks, resist the urge to “try harder” with the same approach. Instead, diagnose the barrier.
One framework we use comes from the Simple View of Reading (word recognition × language comprehension = reading comprehension).
Group A: No difficulty. Students are meeting goals, keep moving them forward.
Group B: Word recognition weaknesses. Focus intervention on phonics, decoding, and fluency.
Group C: Language comprehension weaknesses. Target vocabulary, background knowledge, syntax, and oral language.
Group D: Weaknesses in both areas. Provide integrated intervention with careful attention to pacing.
This quadrant model helps you pinpoint what kind of instruction to adjust rather than guessing.
Step 4: Use the Data to Drive Next Week’s Lessons
The point of analysis is not to create pretty charts (although we love pretty charts!); it’s to shape instruction.
Ask yourself:
Which skills should I reteach?
Which skills are ready to move on?
Which students need a different level of support?
Use your session data to adjust immediately, not just during formal progress monitoring periods.
Why This Matters
Without analysis, data is just numbers. With analysis, data becomes a roadmap for instruction, telling you when to celebrate, when to adjust, and where to target support.
And remember: data is not personal. It’s not a reflection of you as an educator. It’s a tool to make sure every student has the best chance to succeed.
Next Steps for You
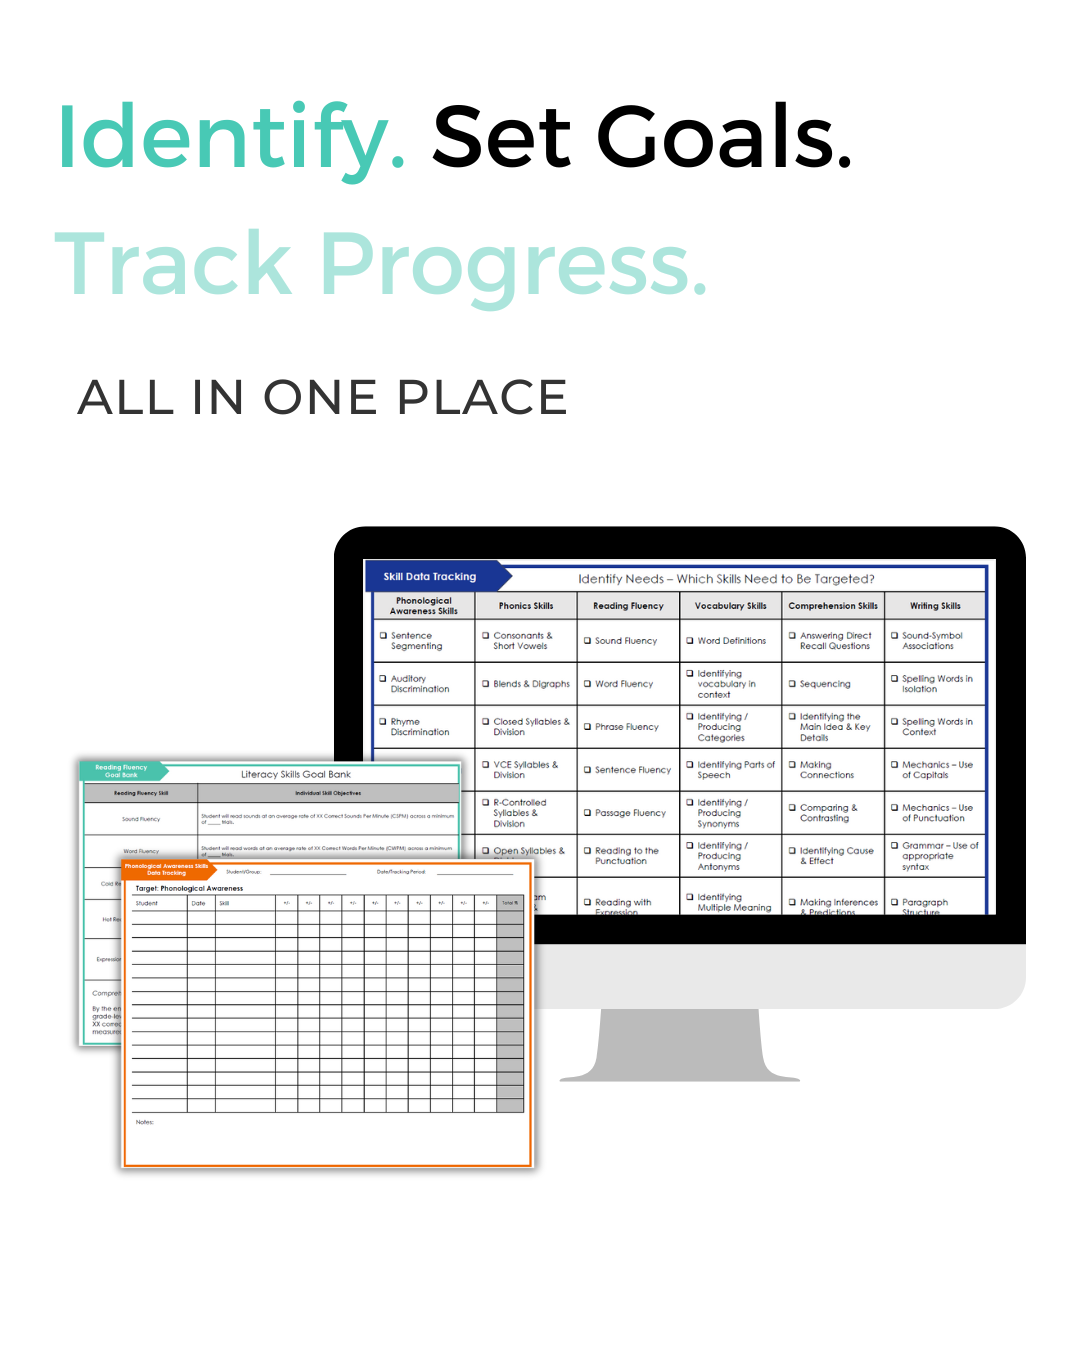
We’ve created a free set of Progress Monitoring Sheets to help you capture the full picture, across phonological awareness, phonics, vocabulary, fluency, and comprehension. It’s designed to help you notice trends, strengths, and to set appropriate goals.
And if you want to take this process further, join our Spotlight PD: Progress Monitoring Made Simple.
Inside, we’ll walk you through how to:
Identify skill gaps across the five core components
Write measurable goals that guide instruction
Track meaningful growth (even when it’s slower than you’d hoped)
Adjust instruction based on what the data and the student are telling you


